


An average individual checks the phone 58 times each day, spending 3 hours and 15 minutes using it. iPhone users vs Android users’ personality features may differ. But one thing is for sure — a modern life without a smartphone seems almost impossible.
More than 6.5 billion people have smartphones. With such a large number of active devices and their usage, it is no surprise that mobile data traffic reached a staggering 77 exabytes per month in 2022.
Therefore, mobile application development is a must for any company if it wants to survive, be it a small, fast-growing startup or a considerable enterprise.
In this article, we are going to compare Android and iOS, the two most popular operating systems, highlight their main features, and look at cross-platform development. Since iOS is used exclusively on Apple’s mobile devices, this comparison is often framed as android vs apple users as well as iPhone vs. Android.
Android vs iOS market overview
Market research is vital for understanding user demographics and behavior. For our analysis, we focused on three major Android vs iPhone market parameters to compare: market share & geography, the number of applications, and mobile app revenue. A common business question is: are there more iphone users or android users globally, and how does that affect product strategy?
Market share in the world
According to the latest surveys, Android accounts for slightly more than 70% of the global market, while iOS represents around 27% (as of December 2022).
However, there are significant regional differences. For example, if we look at the Apple vs Android market share in Europe, the distribution is 32% and 67%, respectively. At the same time, almost 56% of US users prefer iOS, and only 44% — Android.
Globally, Android maintains its leading position in almost all regions. Here is the map depicting the most used OS in every country.
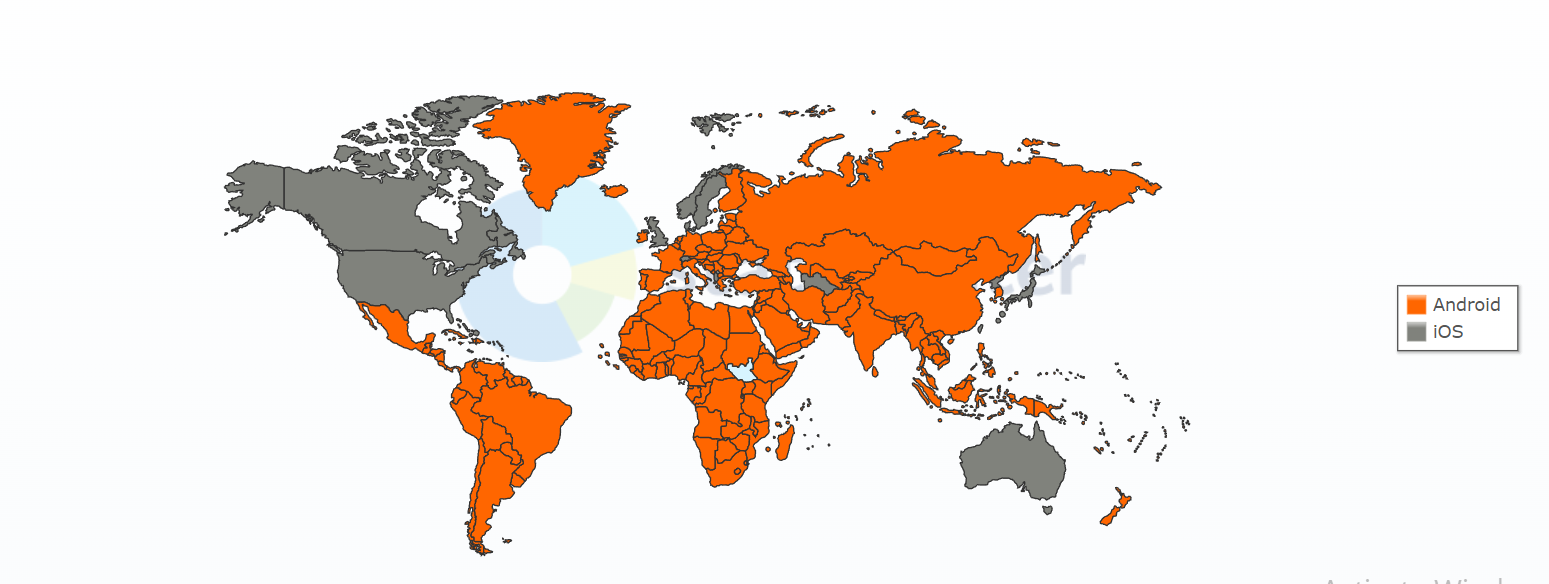
Source Statcounter
Number of available applications
Aside from the number of users, an operating system’s position on the market is characterized by the number of available apps. As of the 3rd quarter of 2022, Google Play is the number 1 app store in terms of application quantity. It contains a little more than 3.55 million apps.
At the same time, iOS users can find approximately 1.6 million apps in Apple’s App Store. Both numbers are enormous. It suggests that app developers strive to meet the versatile tastes of their vast audiences – ios users vs android users.
As we can see, iOS developers have some advantages. Especially considering Apple’s policy, according to which developers receive 70% – 85% of the subscription price, minus applicable taxes.
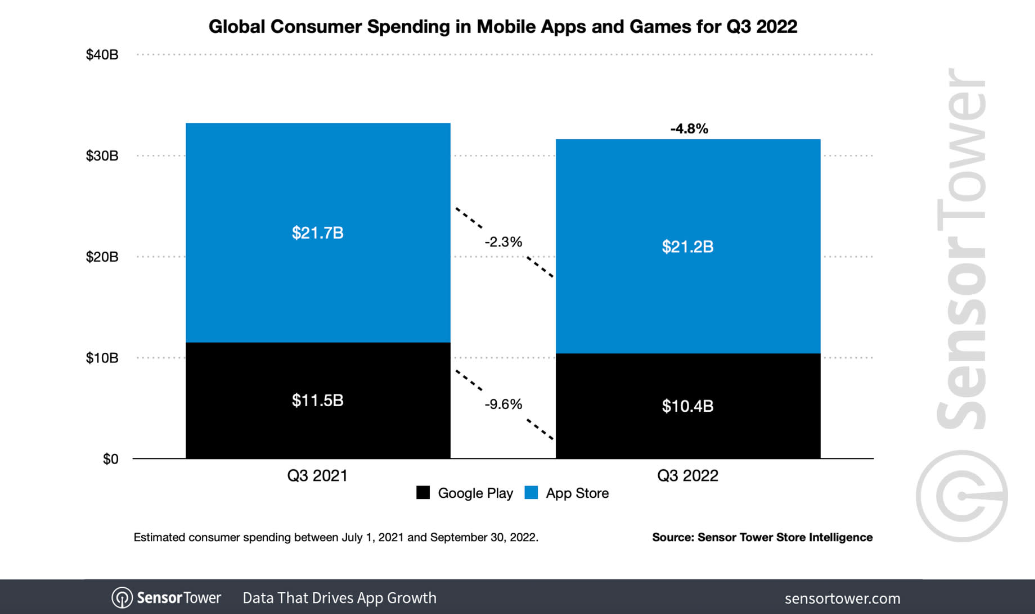
Source SensorTower
iOS and Android basic comparison
Comparing operating systems is challenging, primarily because of the large number of parameters. To better understand iPhone users vs. Android users and the peculiarities of iOS and Android development, we prepared a summarized comparison table depicting the main similarities and differences between both platforms.
| iOS | Android | |
| Developer | Apple Inc. | Open Handset Alliance + Google |
| Global market share | 27% | 70% |
| Number of apps | 1.6m | 3.55m |
| Global revenue of apps (Q3 2022) | $21.2b | $10.4b |
| Device compatibility | Apple only | Samsung, Google, Motorola, LG,and others. |
| Programming language | Swift/SwiftUI, Objective C (old legacy code) | Kotlin, Java |
| Source model | Proprietary (with some open-source elements) | Open source |
| Localization | 73 | 100+ |
| Marketplace for mobile apps | Apple App Store only | Google Play Store + other less popular marketplaces like Aptoide or Galaxy Apps |
| Customization level | Limited customization | Highly customizable |
| Age group | Mostly 18-24, 25-34 groups in the majority of countries | Mostly 35-49, 50+ groups in the majority of countries |
| User economic profile | – Higher-income on average – 26% more likely to spend money – 50% more likely to have been to over 5 countries |
– Lower-income on average – 29% more likely to save money – 71% more likely to have never left their country |
| Customer loyalty | High and steady | High |
| Comparable in-app spending | Higher | Lower |
| User perception of security | Perceived as highly secure | Perceived as not very secure |
| Average salaries of developers | Slightly higher | Slightly lower |
As we can see, iOS and Android development have peculiarities. These stem from technical differences between the platforms and specific features of target audiences. Let’s move to iPhone users vs Android users’ personality comparison.
iPhone vs Android users personality

Created by Fireart Studio
So, we have already presented differences in statistics according to the iPhone vs Android users study and a basic overview of the two platforms. Let’s now put the numbers aside and talk about the more human, personality-centered dimension of smartphone consumers. Multiple surveys show that there are truly significant differences between android and iphone users personality traits.
iOS-lovers
Are iPhone users more liberal or conservative? They tend to be more extroverted and 17% more likely to prefer liberal political views. This might correlate with Apple’s country of origin and the dominant system of values there.
In addition, iOS users are 26% more likely to spend money rather than save it. It’s important to mention that the average iPhone price is usually higher than the price of most smartphones operating on Android.
The research reveals some other interesting aspects of an average iOS user’s personality. iPhone users more often consider their smartphone as an object of status. They also display higher levels of emotionality.
Android followers
On the other hand, Android users are 12% more likely to be introverted, 29% more likely to save money, and 20% more likely to support conservative politics. In addition, most Android users tend to be followers, unlike iOS users, who consider themselves to be leaders. This often leads to the stereotypical phrase android users be like when discussing their practical and customization-oriented mindset.
The same research shows that Android users are more honest, sincere, and fair. They tend to be more imaginative and, consequently, do not like buying everyday products, preferring more unique ones.
Summing up, here are some of the most important findings about iPhone users vs Android users personality types.
| iOS | Android | |
| General personality type | Rather extroverts | Rather introverts |
| Political preferences | More liberal | More conservative |
| Financial behavior preferences | Spending money | Saving money |
| Emotional component | High emotionality | More reserved behavior |
| Smartphone perception | Rather an object of status | Rather a useful tool |
Such differences in the kinds of users of Android vs iPhone personality certainly influence the Android or iOS development strategies common for a particular OS: customization, system openness, and usability. They also influence the main digital design trends.
However, the differences in users’ personalities are closely linked to the demographics of the two platforms’ users. So, let’s analyze this parameter, too.
Android vs iPhone demographics

Source hudexplorernews.org
As the iPhone vs Android users study shows, demographics is undoubtedly among the most important aspects to consider when choosing between iPhone and Android, especially when analyzing android vs iphone users from different regions and age groups. However, making generalizations is difficult in this case. Many factors influence this metric, such as
- Education
- Social and economic status
- Country
- Even province
In addition, preferences can change over time. However, here are some findings about the crucial differences between the demographics of Apple users and their Android counterparts.
| iOS | Android | |
| Dominant age group | 18-34 | 35+ |
| Dominant gender group | Female | Male |
| Innovation entry threshold | Early adopters | Late majority |
| Geographical distribution | Higher presence in countries of the “Western world” | Approximately evenly around the world |
Here are some more details.
- Age. iOS is more prevalent among younger generations, while older people prefer Android. The 2019 research shows that in the 16-24-year-old age group, 44% of people preferred iOS, and only 30% — Android. If we take a look at the most recent survey of the US market, we can see that among people aged 18 to 29, 60% of people use iPhones. At the same time, however, in the 50-64-year-old age group, the share of Android users reaches 56%.
- Gender. Android OS is more prevalent among men (its users are 10% more likely to be male). In comparison, most iPhone users are women (iOS users are 18% more likely to be female).
- Geographical distribution. Though Android is more popular globally, there are some countries where iPhone users are the majority. The United States, the United Kingdom, Canada, and Australia are the most vivid examples.
Keeping this data in mind, we can finally sketch the iPhone vs Android users’ personality portraits and better understand the android vs ios user experience across different demographic segments.
iOS vs Android customer portraits
So, we have analyzed the situation in the mobile OS market and compared Android and iOS users’ demographics and personalities. Now, it’s time to finalize customer portraits for every platform. We can highlight such distinctions in the average iOS and Android customer’s portrait.
| iOS | Android | |
| Average income (USA) | $45-65k | $30-45k |
| Financial behavior | 26% more likely to spend money | 29% more likely to save money |
| In-app spending (per user per app) | $1 | $0.47 |
| Average screen time | Almost 5 hours | A little bit less than 4 hours |
| Traveling | 50% more likely to have been to over 5 countries | 71% more likely to have never left their country |
Android Users vs iPhone Users: income level and spending habits
Let’s now examine some of the differences in detail.
- First, let’s look at income level and spending habits. An opinion poll conducted by a crowdsourced shopping platform, Slickdeals, in 2018 revealed that across the United States, iOS users earn, on average, more than Android users. The average income for iOS users was $53,231 per year, while that for Android users was $37,040.
- These features correlate with the prices of smartphones. iPhones are usually more expensive than models using Android produced by, for example, Samsung or Xiaomi. In addition, as we mentioned previously, iOS users are more likely to spend money rather than save it.
- According to the same survey, iOS users spend approximately 1 hour longer looking at their phones per day than Android users. The average screen time for iOS users is 4 hours and 54 minutes, while for Android users, it is 3 hours and 42 minutes.
- At the same time, Android users are more responsive to push notifications. In contrast, iOS users are almost 10% less likely to react to a notification. For instance, the 2021 survey by Airship provides the following reaction rate estimations: 4.6% for Android vs 3.4% for iOS. Understanding this difference is crucial for building an efficient customer engagement strategy, as well as Android and iOS app design.
- According to the survey, iOS users spend more on in-app purchases. This spending is expected to reach $1 per user per app in 2022, compared to $0.47 for Android users. Mobile app consumer spending statistics (worldwide) show a twice-larger figure for iOS: $92 vs $45 billion in the App Store and Google Play.
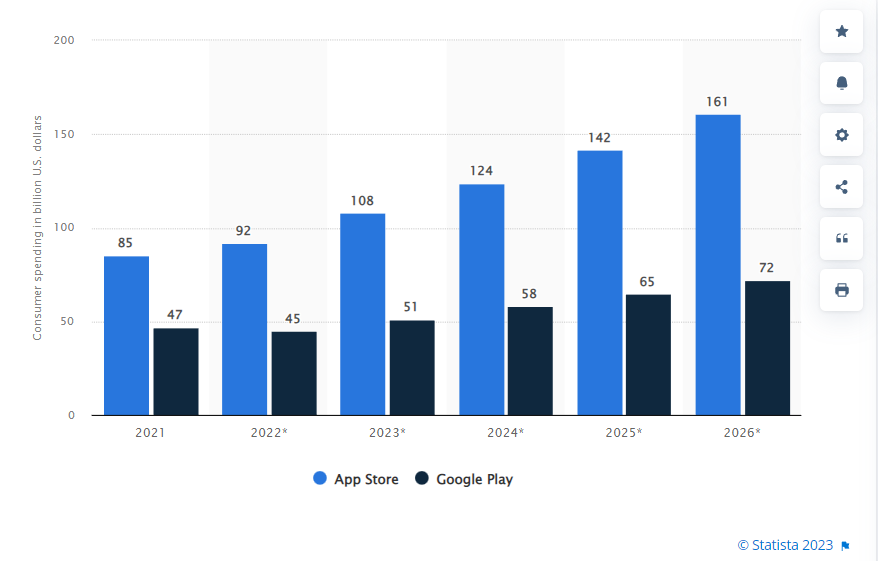
Source Statista
However, despite these differences, both user categories share one common feature — high customer loyalty, around 90%.
iOS vs Android: technical differences

Source Wikimedia
At the end of our review, we would like to highlight some of the most important technical differences between iOS and Android. These differences certainly influence users’ behavior, though they are not related to users’ Android vs iPhone personality.
| iOS | Android | |
| Smartphone brand compatibility | iPhone only | Samsung, Vivo, Xiaomi, and many others |
| Source model | Proprietary | Open source |
| Popular programming languages | Mainly Swift | Java, Kotlin, and C# |
| Control over OS | Limited | Full |
| Comparable OS customization level | Low | High |
Here is a more detailed breakdown of some of the iPhone vs Android distinguishing features.
- First is hardware compatibility. iOS is available only on smartphones designed by Apple – iPhones. On the other hand, you can see Android OS on devices manufactured by multiple companies from all over the world.
- Second, openness. Android is an open-source operating system, while iOS belongs to a proprietary source model with only some open elements. Consequently, iOS developers have less room to maneuver.
- Third, iPhone vs Android centralized and decentralized models directly correlate with security issues. A closed-source iOS is historically more secure since Apple checks every app that gets added to the App Store to look for any malware. In addition, downloading apps out of the Apple App Store is complicated.
- On the other hand, since Android is available on different devices, it is often up to the devices’ manufacturers to provide security updates. Unfortunately, some companies often tend to lag in this.
- Control and customization. iPhone users don’t have complete control over their devices. As for Android, users can receive complete control, even unlock the bootloader. Android users can also enjoy a much higher customization available, allowing them to adjust the OS to their particular needs.
- Finally, programming languages in use. Software engineers can choose several languages for both native Android and native iOS development. In practice, however, the situation is different. Android developers actively use at least three languages – Java, Kotlin, and C#.
As for iOS development, Swift is the best and certainly most widely used language. Objective C stays in old projects, while C++ is not popular.
How to choose the right platform for a mobile app?
Android vs. iOS debates have a long history and will certainly continue as both operating systems evolve. Both operating systems have unique features, advantages, and disadvantages. It is highly desirable for any business to be present on both platforms. However, if business owners have to choose between them, how do they choose the right one?
The answer is to understand and constantly examine your customer’s profile. Conduct comprehensive market research, study behavioral patterns, research the audience’s preferences, examine their personalities, and pay attention to the technical aspects. Does this sound too complicated?
Fireart offers top-notch iOS and Android app developers for hire. Timely, data-driven solutions delivered by an expert R&D team offer businesses reliable mobile app analytics tools to stay resilient and competitive in the market.
Custom application development, multi-level testing, and elaborate and user-friendly product design guarantee the highest level of user satisfaction.
In addition, with Fireart, you may no longer worry about product visibility and customer awareness. Professional branding solutions that cover iPhone vs. Android users analysis allow you to build a long-lasting reputation.
Finally, experienced analysts and marketing experts can provide comprehensive assistance with the product launch.
Contact us to boost your business with our mobile application development services!


