


It’s better to keep records in UX statistics simply because the quality design affects the profit. To estimate this effect better and track other correlations, statistics may be used to foresee the economic impact on the company, which is estimated by design.

Designed at Fireart Studio
Importance of user experience
User experience statistics help companies with the best financial performance understand that design needs to be addressed at the highest level to boost sales, improve ROI, and many other significatives. And this is in relation to large sizes, artificial intelligence, social networks, and smart devices.
Thanks to all it, you may collect a huge amount of information about user preferences, analyze it, get insights and get information about contacts, hire ux developers. Even small startups nowadays may show you how to make the right decisions through prototyping and iterative learning. The user should be in the center of attention at all stages of product development – and modern technology allows you to achieve a huge number of opportunities. And then gather the data on that in the form of compelling UX stats.
User experience statistics by Fireart
Since research and statistics are essential parts of UX and design thinking, the Fierart team has handpicked some useful data that counts in terms of what is UX in statistics, reflects why it’s important and what designers usually do great ui ux design services to produce great UX/UI products. Here we go:
General
The ROI on UX investments is 9,900%. (Truelist)
A study from the University of Kent reveals four main areas that respondents say designers work on at some point in their UX/UI careers:
- Websites and web applications: 94%
- Mobile apps: 67%
- Enterprise applications: 60%
- PC Apps: 54%
The Nielsen Norman Group also surveyed 963 UX design professionals. According to it, UX professionals with 4-6 years of experience make up the largest group (27%)
Every $1 invested in UX results in a return of $100 (ROI = 9,900%).
39% will stop engaging with content when the images won’t load or the loading time takes too long.
85% of adults think that a company’s mobile website should be as good or better than their desktop website. (UXcam)
UX stats show that companies that put any effort into improving their website’s UX design see an increase in their KPIs of up to 83% in conversion lift. These statistics prove that improving customer experience is essential to a business. Also, the companies leading in UX outperformed the S&P index by 35%. (Truelist)
Mobile
21- 48% of users are annoyed by bad mobile optimization.
19 – 96% of users often come across websites that weren’t optimized for mobile at all.
20 –67% of mobile users say they’d rather reward a mobile-friendly website by buying a product/service there than from one of its competitors. (Userguiding)
Ecommerce
88% of consumers are less likely to return to a site with bad UX. Out of all these user experience statistics, this one is still one of the most important.
As per a report, 88% of online consumers are less likely to return to a site after a bad user experience. This trouble isn’t limited to websites though. (Startupbonsai)
UX best practices
UX is not (only) UI. And you may make sure of it by viewing some useful examples:
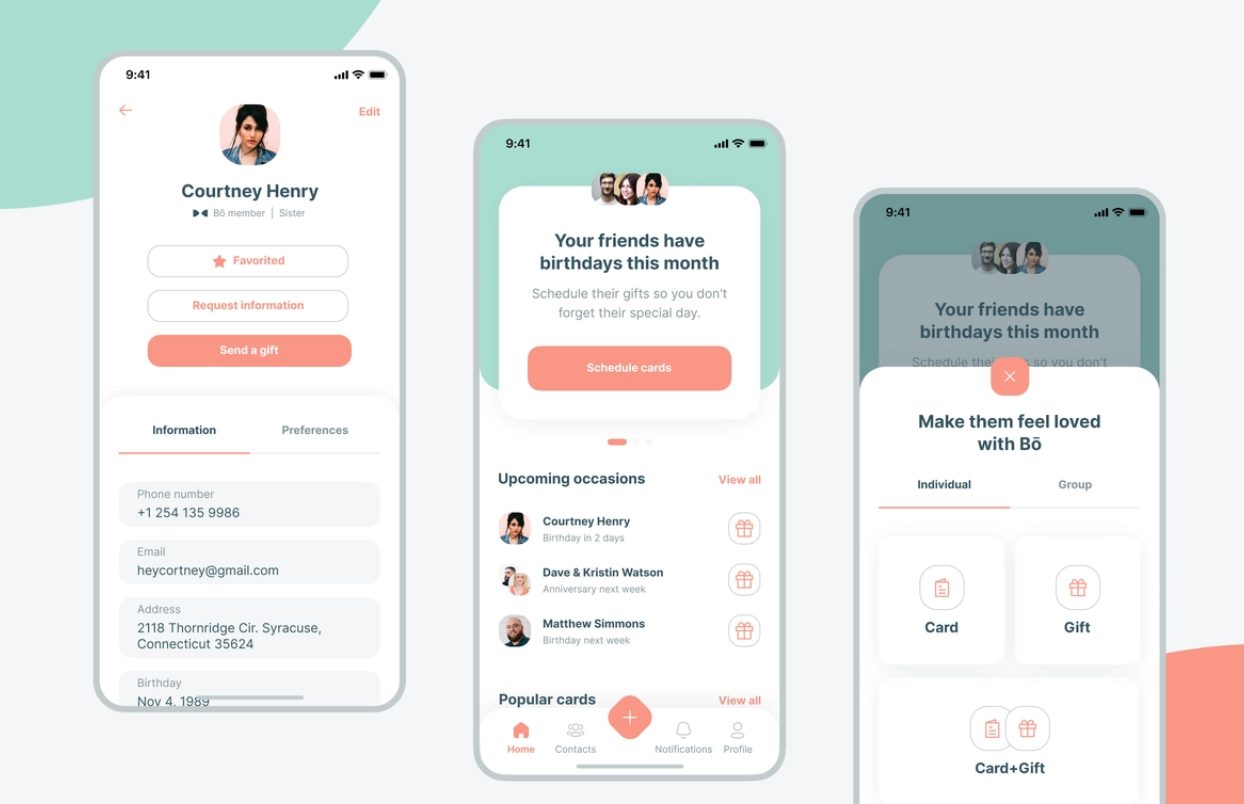
Bo App
Know your audience and mind that you are not the user.
E-learning Dashboard – Analytics
Adapt design for short attention spans because your UX process isn’t set in stone. It should touch and move.

Prototype before you build a real product or an MVP. It’s better to test everything prior to the finalization to avoid serious product drawbacks.
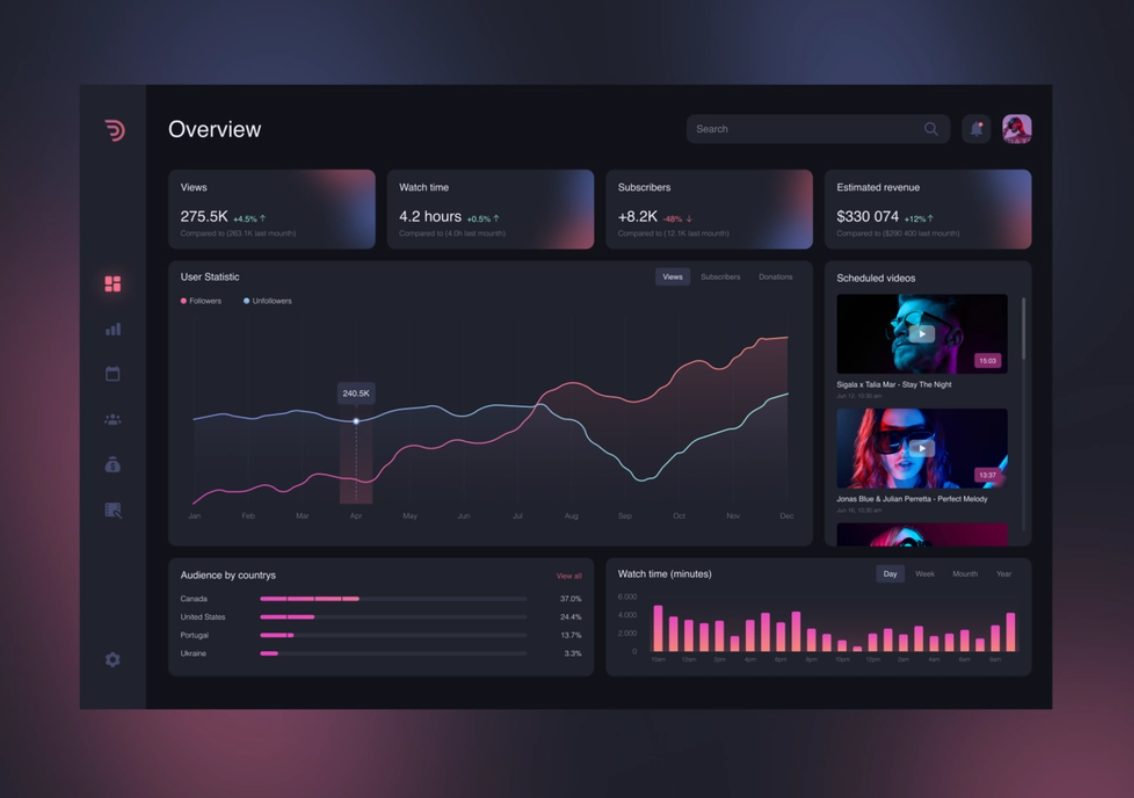
YouTube analytics
Use great content when designing and do your best to keep things simple and consistent.
E-book App

Apply user experience infographic if you can.
Infographic is a great way to present your data in an engaging form and improve the way your customer not only feels the product but also perceives the data related.
Conclusion
Any consumer statistics helps to assess the scale of a phenomenon and develop a system of methods for analysis and study to improve the index over and over again. The customer experience stats enable industries and designers who serve them to better adapt to the market changes, align finances and other resources, and much more.
You better understand that design needs to be addressed at the highest level to boost sales, improve ROI, and many other significatives as per your current business goals. And this is helpful in a combination with other data-driven activities, artificial intelligence, social networks, smart device analysis, etc. It allows you to give an objective assessment of the financial condition of the company through the design investments, identifies problems and weaknesses of the organization and the products it release, etc. So, it’s never too late to look up some UX stats and other insights for staying abreast of your company industry and so much more.


