

Top 3 data visualization agencies in 2026
| Agency | Best for | Clutch rating | Starting budget |
|---|---|---|---|
| 1. Fireart Studio | Customer-facing dashboards designed and built by one team | 4.9 (40 reviews) | $10,000+ |
| 2. Fuselab Creative | Government and healthcare dashboards inside Power BI or Tableau | 5.0 (15 reviews) | $25,000+ |
| 3. CLEVER°FRANKE | Enterprise data products with award-level design | No reviews yet | €25,000–50,000 |
Most teams searching for a data visualization agency are really shopping for one of three different things. A SaaS founder needs an analytics dashboard customers will open every morning. A head of data needs a Power BI or Tableau setup that executives stop ignoring. A communications team needs an interactive story that turns a dense report into something people share.
The same search term covers all three jobs, and the agencies that rank for it rarely say which one they are built for. I wrote this guide for the people who have to make that call: product owners, data leads and marketing directors with a budget, a deadline and a dataset that is messier than anyone admits.
At Fireart we design and build data-heavy products, and the pattern I keep seeing is simple. Dashboard projects rarely fail on chart choice. They fail on the data underneath, on interactions nobody tested with real users, and on a designer-to-engineer hand-off that loses half the intent.
So every agency below is judged on the same five criteria: data depth, dashboard and interaction UX, engineering delivery, domain proof and engagement fit. Positions reflect fit for a situation, not a quality score. Where another studio is the better choice than us, I say so.
TL;DR
- There is no single best data visualization agency, only studios built for different jobs: product dashboards, BI consulting and training, and editorial data storytelling. Pick the job first, then the name.
- Data depth outranks visual polish. Ask who cleans and models the data before you look at a single chart. Gartner research from 2020 puts the average cost of poor data quality at $12.9 million per organization per year.
- Accessibility is now a contract requirement. The European Accessibility Act has applied to consumer banking and e-commerce services since 28 June 2025, and US state and local governments with 50,000+ residents must meet WCAG 2.1 AA by April 26, 2027.
- The most-awarded studio is often the wrong pick for an operational dashboard. Award-winning editorial pieces are built to be read once; product dashboards are built to be used every day.
- Most of a dashboard budget goes into data preparation and engineering, not into the charts themselves. Two quotes that look far apart often price different scopes.
- Vet partners on a live dashboard you can click through, the person who owns the data layer, and who writes production code. Dribbble shots and award lists tell you much less.
How to choose a data visualization agency
Start with the job, not the portfolio. A studio that wins awards for interactive journalism and a studio that ships analytics modules inside a SaaS product share a label, but almost nothing in their process, team or pricing.
The five criteria every agency is judged on
- Data depth. Does the agency question, clean and model the data, or does it style whatever spreadsheet you send? A beautiful chart of wrong numbers is a liability.
- Dashboard and interaction UX. Can they design for daily use: role-based views, filters, drill-downs, empty states and alerts? Static infographics and one-off editorial pieces are a different skill.
- Engineering delivery. Do they write and maintain production code (React, D3, WebGL, BI tools), or hand Figma files to your developers and step away?
- Domain proof. Named clients and case studies in your industry, not a line about working across sectors.
- Engagement fit. Team size, typical budget, time zone and minimum project size compared with yours.
What these criteria do not measure
Star ratings and award counts. A 5.0 from three reviews and a 4.8 from forty are not comparable, and most data visualization awards reward editorial storytelling far more than dashboards people use every day.
Who this guide is for
- SaaS, fintech and healthtech teams adding customer-facing analytics to a product.
- Data and BI leads whose internal dashboards exist but are not being used.
- Communications, research and nonprofit teams that need to publish data stories people actually read.
The 10 agencies covered
- Fireart Studio: customer-facing dashboards and data-heavy SaaS or fintech products, designed and built by one team.
- Fuselab Creative: government and healthcare dashboards, often inside an existing Power BI or Tableau setup.
- CLEVER°FRANKE: enterprise data products and platforms with award-level design.
- Interactive Things: open-data portals and statistics dashboards for public bodies.
- Graphicacy: live public dashboards and data stories for US nonprofits and policy groups.
- Datalabs Agency: Power BI and Tableau dashboards plus the training that gets them used.
- Accurat: data visualization design languages and editorial data experiences.
- Fathom Information Design: custom data tools for science, health and finance.
- The Visual Agency: business dashboards, BI guidelines and data storytelling for European corporates.
- Beyond Words Studio: data-driven reports, animations and explainers for communications teams.
| Agency | Best for | Headquarters | Published entry pricing | Strongest industries |
|---|---|---|---|---|
| Fireart Studio | Product dashboards, design plus build | Warsaw, Poland | $10,000+ minimum, $50–99/hr | Fintech, SaaS, energy |
| Fuselab Creative | Public-sector and healthcare BI | McLean, Virginia, USA | $25,000+ minimum, $100–149/hr | Government, healthcare |
| CLEVER°FRANKE | Enterprise data platforms | Utrecht, Netherlands | €25,000–50,000 typical start | Public health, music, cybersecurity |
| Interactive Things | Open-data portals | Zurich, Switzerland | Design sprint from CHF 20,000 | Government, international organizations |
| Graphicacy | Mission-driven public dashboards | Washington, DC, USA | Not published | Nonprofits, policy, public health |
| Datalabs Agency | Power BI and Tableau adoption | Melbourne, Australia | Workshops AU$4,600–7,500 | Hospitality, automotive, government |
| Accurat | Data design languages | Milan, Italy | Not published | Enterprise tech, policy, culture |
| Fathom Information Design | Custom scientific data tools | Boston, Massachusetts, USA | Not published | Life sciences, finance |
| The Visual Agency | Business dashboards and BI guidelines | Milan, Italy | Not published | Energy, pharma, finance |
| Beyond Words Studio | Data reports and explainers | London, UK | Not published | Global health, consulting |
Pricing comes from each agency’s site or its Clutch, Sortlist or Datalabs shop listing, checked in October 2026. The cards below explain each placement.
1. Fireart Studio
Specializes in: Customer-facing product dashboards · Fintech and SaaS interfaces · Design plus full-stack build
- Headquarters: Warsaw, Poland; 80% of clients are in the US
- Founded: 2013
- Team size: 50+ designers and JavaScript developers
- Clutch rating: 4.9 from 40 verified reviews
Evaluated on the basis of
- Data depth: Designs around the data model, not on top of it. For Sprightful, solar devices were polled through a cloud API every 5 minutes and turned into generation, consumption and savings views, including billing logic that compares solar with grid cost. No in-house data science or BI modeling practice is publicly claimed.
- Dashboard and interaction UX: The CFI app redesign covered 250+ screens with a customizable home dashboard, trading and portfolio views, and light and dark themes. Hot Desk added an admin panel with desk utilization analytics.
- Engineering delivery: Ships production code in React, Next.js, Node.js and React Native. Sprightful was a 10-month design-and-build engagement that included a custom backend.
- Domain proof: Fintech (CFI, a UAE multi-asset broker), energy (Sprightful), workplace SaaS (Hot Desk) and retail pricing analytics (Revionics).
- Engagement fit: Clutch lists a $10,000+ minimum. Work runs hourly, per project or as a dedicated team, and staff augmentation suits teams that already own their data stack.
Differentiator
Plenty of agencies design a dashboard and hand the files to someone else. Fireart designs and builds it inside one team, which matters for product work because dashboards usually break at the seam between the design file and the API. On Sprightful the same people ran discovery, UX, UI and the full-stack build, then added database indexes after launch to cut read time and hosting costs.
Proof of execution
- CFI: a corporate site redesign whose design system was reused for CFI Prime and Trading Transparency+, plus a mobile app redesign across 250+ screens. The case study reports +25% user engagement and retention.
- Sprightful: a mobile-first energy management MVP that turns solar device data into dashboards, built from March to December 2020 on a React front end and a custom backend.
- Revionics: a Director of UI/UX at this retail pricing and data science company wrote on Clutch that Fireart built their research and UX teams from scratch and delivered a design system for three platforms, with spend of around $250K.
Pricing
$10,000+ minimum and $50–99 per hour, per Clutch. Engagements can start with a separate discovery and scoping phase.
Potential limitation
Fireart is not a BI consultancy. If you need Tableau or Power BI licensing advice, a data warehouse built or analysts trained, start with a BI specialist further down this list. We are also the wrong pick for a one-off editorial data story for a newsroom.
My take
If your dashboard lives inside a product people pay for, keep design and front-end engineering in the same room. What sinks customer-facing analytics is rarely the chart type. It is the empty state for a brand-new account, the loading pattern on a slow query and the permissions logic nobody drew. Our dashboard design best practices go deeper on these details, and the product design page shows how an engagement runs.
If your buyer is a public agency or a regulated healthcare organization rather than a product team, the next studio is built for that procurement reality.
2. Fuselab Creative

Specializes in: Government and healthcare dashboards · Design layers for Power BI and Tableau · Map and geospatial interfaces
- Headquarters: McLean, Virginia, USA
- Founded: 2017
- Team size: 10–49 (Clutch)
- Clutch rating: 5.0 from 15 reviews
Evaluated on the basis of
- Data depth: The stated process includes normalizing and reconciling data sources, and a Clutch reviewer credits the team with merging large public datasets. On the POGO COVID-19 spending tracker, the data science side sat with partner firm rs21.
- Dashboard and interaction UX: Its strongest criterion. The work is operational: a layered Medi-Cal dashboard for California DHCS that runs from an executive overview down to configurable analysis, and the Fiserv Small Business Index with interactive charts and GIS mapping.
- Engineering delivery: Offers dashboard development and names D3.js, Recharts, Tableau, Power BI and Mapbox on its data visualization page. Published case studies mostly document design work, and Clutch puts custom software at 15% of its service mix.
- Domain proof: Government (California DHCS, POGO), fintech (Fiserv), data and AI platforms (Stardog), healthcare and commercial real estate (Avison Young).
- Engagement fit: $25,000+ minimum and $100–149 per hour on Clutch, US Eastern time, and a GSA MAS contract that lets US federal agencies buy directly.
Differentiator
Fuselab works inside the BI tools a client already owns. For California DHCS it built custom design modules within the state’s existing Power BI environment instead of proposing a rebuild, which is often the only path public procurement allows.
Proof of execution
- POGO COVID-19 Relief Spending Tracker (2020): interface design for a tool that, by November 2020, mapped about $1.6 trillion in federal relief down to county and zip code level.
- California DHCS: a Medi-Cal long-term services dashboard built as custom modules inside Power BI, with the case study published in May 2025.
- Stardog: the VP of Product at this data and AI platform company rated the 2024 design engagement 5.0 on Clutch and linked it to higher win rates and user satisfaction.
Pricing
$25,000+ minimum and $100–149 per hour, per Clutch. The CEO has said in a GoodFirms interview that the firm generally avoids projects under $20,000.
Potential limitation
Fuselab is design-led. If you need an agency to own the data pipeline or the production front end of a heavy analytics product, confirm who writes the code before you sign. One Clutch reviewer also flagged early scheduling delays on a 2025–2026 engagement.
My take
For a US public agency or a health system that already licenses Power BI, Fuselab is the safest call on this list. Making a mandated tool pleasant to use is unglamorous work, and most studios would rather sell you a rebuild. I would not hire them for a SaaS analytics module from scratch without meeting the engineers first.
If the dashboard is the product itself and needs both data engineering and design-award polish, the next studio plays at a different budget level.
3. CLEVER°FRANKE
Specializes in: Data products and platforms · Data design systems · Award-winning data stories
- Headquarters: Utrecht, Netherlands, with an office in Chicago
- Founded: 2008
- Team size: About 50, inside ADC Consulting (200+ people) since October 2024
- Clutch rating: No reviews (unclaimed profile)
Evaluated on the basis of
- Data depth: Strong. For Warner Music Group’s OPUS platform it handled data engineering and the API specification. For the T1D Index it structured 30.18 million pre-calculated records behind a scrolling story and a simulator.
- Dashboard and interaction UX: Covers both worlds: operational platforms for WMG and cybersecurity firms such as Blackpoint, plus editorial microsites and physical data installations.
- Engineering delivery: Ships production code, including React and D3 front ends, DevOps and ongoing maintenance on OPUS. The Dutch national Corona dashboard shipped with keyboard-accessible charts and an open-source codebase.
- Domain proof: Public health (Dutch Ministry of Health), music (Warner Music Group), cybersecurity (Blackpoint), health research (Breakthrough T1D), tech (Cisco, Google).
- Engagement fit: Premium. Sortlist lists €25,000–50,000 as typical starting budgets, and the Utrecht and Chicago offices cover European and US Central hours.
Differentiator
Few studios are both a design-award machine and a data engineering shop. CLEVER°FRANKE was Red Dot Agency of the Year in 2023 and European Design Agency of the Year in 2025, yet its best-known platform is a tool WMG staff use every day. The ADC acquisition puts a data and AI consultancy behind the design team.
Proof of execution
- Dutch national Corona dashboard: version 1.0 went live within a week of first government contact in May 2020 and was iterated to version 4.0 by December 2021. It won a Red Dot in 2021.
- WMG OPUS: research with 60 user interviews and 45+ stakeholders, then a full-stack build. The agency says the platform saves 2.1 million hours of manual data processing a year.
- T1D Index for Breakthrough T1D: data stories plus a simulator covering 1,008 interventions across 213 regions from 2000 to 2040. It won a European Design Awards Bronze in 2025.
Pricing
Not published. Sortlist shows starting budgets of €25,000–50,000, and an unclaimed Clutch profile lists $100–149 per hour.
Potential limitation
Wrong for small budgets or a quick Power BI configuration. There are no third-party client reviews on Clutch or Sortlist, so procurement teams that need verified references will have to ask for them directly.
My take
If the dashboard is the product and the board will see it, this is the studio I would shortlist first in Europe. The Corona dashboard is the case to study: one week to version 1.0, then eighteen months of iteration. That is how public dashboards should be built, and few portfolios show that patience.
CLEVER°FRANKE works across editorial and operational work. The next studio leans harder into public data infrastructure.
4. Interactive Things
Specializes in: Open-data and statistics portals · Public-sector dashboards · Full-stack data platforms
- Headquarters: Zurich, Switzerland
- Founded: Around 2010
- Team size: 20 (team page)
- Clutch rating: No profile found
Evaluated on the basis of
- Data depth: Offers data analysis, data pipelines, linked open data and GraphQL APIs. For the UNESCO Institute for Statistics data browser, the scope included backend engineering. The work is statistics-office grade rather than machine learning.
- Dashboard and interaction UX: Public dashboards and data portals, including the Swiss Federal Statistical Office’s Cancer Monitoring Dashboard, an electricity price dashboard for regulator ElCom, and live election dashboards for Tamedia.
- Engineering delivery: Strong. At least 10 of the 20 people on the team page are interaction engineers, the stack is TypeScript, React, Next.js and D3.js, and the studio maintains open-source tools such as swiss-maps.
- Domain proof: Swiss federal agencies, UNESCO, OECD, WHO, UBS, NZZ, SRG SSR and the London School of Economics.
- Engagement fit: A small senior team on Central European time. A design sprint starts at CHF 20,000.
Differentiator
Interactive Things builds tools that let other people make good charts. visualize.admin.ch, built for the Swiss Federal Office for the Environment, guides users through creating interactive charts from Swiss open government data. Designing the rules and defaults for thousands of charts you will never see is a different skill from designing one chart well.
Proof of execution
- visualize.admin.ch (March 2022): interface design, data visualization and software engineering for a federal chart-building tool on linked open data.
- Cancer Monitoring Dashboard (December 2024) for the Swiss Federal Statistical Office: a public incidence and mortality dashboard that won a German Design Award.
- UIS Data Browser (September 2024) for the UNESCO Institute for Statistics: a platform for exploring the full education, science and culture dataset, with backend work done alongside partner shiftcode.
Pricing
Design sprints start at CHF 20,000 for two designers over five to seven working days, delivering a prototype and documentation. Larger builds are quoted per project.
Potential limitation
A 20-person studio in one Zurich office, with Swiss pricing and a client list concentrated in the public sector and international organizations. It is the wrong fit for a US SaaS team that needs same-time-zone product work on a tight budget, and there are no public third-party reviews.
My take
If your data is public and your audience is citizens or researchers, look here first. The Swisscom data visualization guidelines, which shipped with a custom Tableau template, are the deliverable I would steal: a one-time investment that keeps every future chart consistent. Ask for one whichever agency you hire.
Interactive Things serves Swiss and international public bodies. For US nonprofits, foundations and policy groups, the closest equivalent is a smaller team in Washington.
5. Graphicacy
Specializes in: Live public data dashboards · Scrollytelling for policy and nonprofits · Data pipeline and API automation
- Headquarters: Washington, DC, USA, with team members in Brooklyn and Los Angeles
- Founded: 2012
- Team size: About 13 people named on the About page
- Clutch rating: No verified reviews found in the sources reviewed
Evaluated on the basis of
- Data depth: High. The CRFB Fiscal Dashboard merges 32 daily API requests with 61 CSV data streams, resampled across daily, monthly, quarterly and yearly cadences. For the Johns Hopkins Coronavirus Resource Center, testing views paired new cases with testing volume and positivity rate.
- Dashboard and interaction UX: Public dashboards and data explorers, plus editorial scrollytelling such as a 2026 piece for the Vera Institute. Little internal BI work.
- Engineering delivery: Full-stack production code. Job listings name React, Next.js, D3, WebGL, Mapbox, Python, SQL and AWS, and the studio is hiring a Director of Data Visualization Engineering.
- Domain proof: Public health (Johns Hopkins), fiscal policy (Committee for a Responsible Federal Budget), climate (WRI, Union of Concerned Scientists) and criminal justice (Vera Institute).
- Engagement fit: A small senior team registered for US federal contracting. Budgets are not published.
Differentiator
Graphicacy treats the data pipeline as part of the visualization, not as the client’s problem. Founder Nathaniel Pearlman previously founded NGP Software, a political campaign software company, and the engineering-first habit shows in how the studio scopes projects.
Proof of execution
- CRFB Fiscal Dashboard (2026): a live federal finances dashboard on Drupal, fed by 32 daily API calls and 61 CSV streams.
- Union of Concerned Scientists, Danger Season tool (2024): an AWS backend API that replaced manual daily CSV generation. A UCS senior social scientist says in the case study that monthly infrastructure costs fell by more than 50%.
- Recognition: two Silver Anthem Awards for Best Use of Data in 2025.
Pricing
Not published. Projects are quoted individually.
Potential limitation
Almost all named work is for nonprofits, foundations, government and academia, built as custom web. There are no Power BI or Tableau case studies, and a team of 10 to 13 people limits how many large builds it can run at once.
My take
Mission-driven organizations usually get squeezed between editorial studios they cannot afford on retainer and BI vendors who do not care about the public reader. Graphicacy sits in the gap. The UCS case is the one to show any finance lead who sees a dashboard rebuild as pure cost: the automation cut the monthly infrastructure bill by more than half.
Every studio so far builds custom interfaces. If your company has already paid for Power BI or Tableau and the problem is that nobody uses the reports, the next agency is the better first call.
6. Datalabs Agency
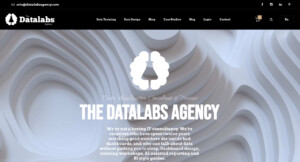
Specializes in: Power BI and Tableau dashboard design · BI style guides and templates · Data visualization training
- Headquarters: Melbourne, Australia (Clutch also lists Long Beach, California)
- Founded: 2012
- Team size: 10–49 (Clutch)
- Clutch rating: No reviews yet
Evaluated on the basis of
- Data depth: Medium. The team audits and cleans source data, and the Marriott APAC project combined five enterprise systems into 73 data fields. No statistical modeling is shown.
- Dashboard and interaction UX: Strong for operational BI: Marriott dashboards with a six-tier drill-down, and 12 Power BI sales dashboards plus a style guide for Mercedes-Benz in Southeast Asia.
- Engineering delivery: Ships production Tableau and Power BI files and at least one coded JavaScript tool. Custom software interfaces in the portfolio stop at concept or prototype stage.
- Domain proof: Hospitality (Marriott), automotive (Mercedes-Benz), philanthropy and education (Michael & Susan Dell Foundation), Australian government and shipping (ZIM).
- Engagement fit: A small team running projects of roughly five to six weeks, with a low entry point through workshops and templates.
Differentiator
Datalabs sells the capability as well as the deliverable. Alongside dashboards it runs nine workshop formats, online courses and Power BI templates, and it trained 287 Lockheed Martin leaders over two days in June 2022. When adoption rather than design is the bottleneck, that matters.
Proof of execution
- Marriott International APAC (2015–16): four production Tableau dashboards over 73 data fields drawn from five enterprise systems, delivered in five weeks.
- Michael & Susan Dell Foundation: a custom education reporting system migrated to Power BI with four dashboards. The case study reports 10,958 unique users and coverage of 22,732 schools.
- Australian Department of Education and Training: an interactive Child Care Subsidy Estimator coded in-house to WCAG 2.0, with a two-week first phase and about 800,000 page views.
Pricing
The most transparent on this list. Private workshops cost AU$4,600–7,500 including GST for up to 12 people, and online courses and Power BI templates are sold individually. Dashboard projects are quoted.
Potential limitation
Wrong for customer-facing analytics shipped inside your own app. The custom product interfaces in its portfolio, such as a traffic management platform for a transport department, are concepts rather than shipped software. There are no third-party reviews on Clutch yet.
My take
A well-designed dashboard that nobody opens is still a failed project. If you already own Power BI, a two-day workshop for the people who build your reports may move adoption more than any redesign. Pair Datalabs with a product studio if your analytics face customers.
The next studios started in information design. All of them also build tools, but their portfolios are strongest where data has to be explained, not just monitored, and that changes what to look for.
7. Accurat
Specializes in: Data visualization design languages · Editorial and experiential data design · Data and AI prototyping
- Headquarters: Milan, Italy, with an office in Brooklyn, New York
- Founded: 2011
- Team size: 10–49 (Clutch)
- Clutch rating: No reviews yet
Evaluated on the basis of
- Data depth: Strong. For the World Economic Forum’s Global Gender Gap Report, Accurat built software in 2016 that generated about 300 pages of country profiles automatically, work data scientists had previously done by hand. Its Tech division now offers machine learning, predictive analytics and data modeling.
- Dashboard and interaction UX: Some operational work, including a real-time threat interface for IBM Security QRadar and an incident-search dashboard for the U.S. Press Freedom Tracker. Most of the public portfolio is editorial, cultural or installation work.
- Engineering delivery: Ships code: production-ready front end for QRadar, open-source React and TypeScript chart libraries on GitHub, and full-stack builds on several projects. No Tableau or Power BI work is shown.
- Domain proof: Enterprise tech and security (IBM), economics and policy (World Economic Forum), journalism and nonprofits (Knight Foundation, Freedom of the Press Foundation), retail and brand (Starbucks, Lenovo).
- Engagement fit: Since February 2025 the company has run as two divisions: Accurat Studio for brand, culture and product experiences, and Accurat Tech for data and AI prototyping. Budgets are not published.
Differentiator
Accurat helped write the visual grammar other teams now use. For IBM it spent a year researching a data visualization design language for about 1,500 designers and built chart templates as web components for the Carbon Design System. Four Information is Beautiful Awards wins, including the 2015 studio award, back up the craft.
Proof of execution
- IBM (2015–2019): a design language for roughly 1,500 IBM designers, Carbon chart components, and production code for the QRadar threat interface.
- World Economic Forum: automated country profiles in 2016, then a map-based explorer covering 150+ countries with data export in 2017.
- Knight Foundation (2018): a scrollytelling piece built in three months from a 60+ page analysis of 10 million+ tweets, later covered by Politico, NPR and Adweek.
Pricing
Not published.
Potential limitation
The wrong pick for dashboards on an existing Tableau, Power BI or Looker stack, or for buyers who need verified references, since there are no third-party reviews. Note too that co-founder Giorgia Lupi, the name many buyers associate with the studio, has been a Pentagram partner since 2019.
My take
If you are setting data visualization standards for a large design organization, Accurat’s IBM work is the benchmark. I would hire them to define how a company shows data, then let a product or BI team apply those rules day to day.
Accurat defines how data should look across an organization. The next studio builds the tools scientists use to make decisions with it.
8. Fathom Information Design
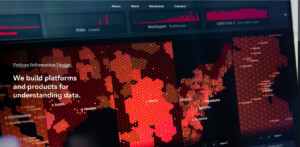
Specializes in: Custom data tools for science and health · Data analysis and storyfinding · Interactive installations
- Headquarters: Boston, Massachusetts, USA
- Founded: 2010
- Team size: 11 (about page)
- Clutch rating: No profile found (the Clutch profile named Fathom belongs to an unrelated company)
Evaluated on the basis of
- Data depth: Very strong. Fathom does its own analysis, and Delphy, a browser tool for building phylogenetic trees made with the Sabeti Lab at the Broad Institute, was published in Nature in September 2026.
- Dashboard and interaction UX: Builds operational tools as well as installations. Lookout, a pathogen surveillance platform that combines testing, sequencing and wastewater data, supported a campus of 10,000+ students. The studio also runs its own data exploration product, Rowboat.
- Engineering delivery: Full production builds: front end, back end and APIs, plus C++, WebAssembly and WebGL. Founder Ben Fry co-created the Processing programming language.
- Domain proof: Health and life sciences (Broad Institute, Mayo Clinic, athenahealth), finance (State Street, J.P. Morgan Chase, Fidelity), media (Thomson Reuters, National Geographic) and philanthropy (Gates and Clinton foundations).
- Engagement fit: About 11 people, with engagements that range from six-week sprints to multi-year programs.
Differentiator
Fathom builds software that experts use to make decisions, not pictures of their results. During the 2025 mpox outbreak in Sierra Leone, a Lookout pilot had a custom view ready within six hours of receiving the data. The studio also states publicly that it does not use generative AI, which some regulated buyers will count in its favor.
Proof of execution
- Broad Institute, Sabeti Lab (2021 to now): the Lookout surveillance platform, with an API built to scale to tens of thousands of users.
- State Street, Growth (2017): 200 years of finance drawn from 40,000 indicators. Stories were found in one week, the installation built in four, and the web version in under four.
- No Ceilings (2015) for the Clinton and Gates foundations: nearly one million data points, with Fathom handling both the analysis and the platform build for web, mobile and touch screens.
Pricing
Service pricing is not published. Rowboat has a free tier and paid plans from $9.99 per month.
Potential limitation
Wrong for dashboards on an existing BI stack, fast-turnaround marketing content or anything that needs generative AI. With about 11 people and long-running pandemic-preparedness work, capacity is limited.
My take
If your data is genuinely hard, such as genomic sequences, outbreak signals or two centuries of financial history, Fathom is the team I would most want to watch work. Their public notebook is one of the best free resources on how serious data tools get built. Ask about availability early.
Between the BI focus of Datalabs and the information design studios above sits a Milan agency that covers both sides.
9. The Visual Agency
Specializes in: SaaS and reporting dashboards · BI visualization guidelines and templates · Data storytelling and motion
- Headquarters: Milan, Italy (part of BIP Group)
- Founded: 2011
- Team size: Under 49 (DesignRush)
- Clutch rating: No verified reviews found in the sources reviewed
Evaluated on the basis of
- Data depth: Medium. The agency sits inside BIP Group, a consultancy with data platform and machine learning practices, but its own case studies focus on design and front end. For Owkin it used custom AI scripts to generate the network structure of its visualizations.
- Dashboard and interaction UX: Strong for business dashboards. For Verco’s MyVerco carbon accounting platform it redesigned three connected dashboards, covering sustainability projects, emission-reduction pathways and energy performance.
- Engineering delivery: Front-end development is credited on MyVerco and on Owkin’s MOSAIC visualizations, built with Matter.js, Rive and a custom component embedded in Webflow. Back-end ownership is not documented.
- Domain proof: Energy and sustainability (Verco, Eni, E.ON), pharma and health (Boehringer Ingelheim, Novartis, Owkin), finance (Intesa Sanpaolo, Allianz) and public bodies (Polis Lombardia, Council of Europe, UNICEF).
- Engagement fit: Mostly large European corporates, Milan time zone, budgets not published.
Differentiator
The Visual Agency fixes the system before the dashboards. For Polis Lombardia it wrote data visualization guidelines with a Figma design system and accessible Power BI and Tableau templates aligned with WCAG. Its TVA Academy has trained 1,000+ people at 50+ client companies, per the agency.
Proof of execution
- MyVerco (2024): three dashboards plus a design system built so the modules can be sold together or separately.
- Polis Lombardia (2024): BI guidelines, accessible color palettes and ready-to-use Tableau and Power BI templates.
- Owkin MOSAIC (2026): two interactive views of multimodal oncology data, with one particle per patient across six data modalities, filterable by tumor type.
Pricing
Not published. TVA Academy runs as 4–8 hour live sessions or a one-hour video course for company teams.
Potential limitation
Its client list is dominated by large European corporates, so a US startup will find few comparable references, and there are no third-party reviews to check.
My take
If you need one partner to tidy up your Power BI estate and also design a customer-facing module, this is one of the more balanced options in Europe. The Polis Lombardia project shows the right instinct: agree on the rules first, then redesign the dashboards.
If what you need to ship is a report, an annual results story or a campaign rather than a tool, the last studio on the list is built for exactly that.
10. Beyond Words Studio
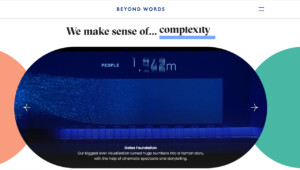
Specializes in: Data-driven reports and explainers · Animated data video · Exploratory public interactives
- Headquarters: London, UK, with offices in Dublin and Florida
- Founded: 2016
- Team size: 10–49 (Clutch)
- Clutch rating: No reviews yet
Evaluated on the basis of
- Data depth: Mainly editorial distillation: turning reports and survey results into visual stories. For the World Bank’s World Development Report 2021 summary, the studio brought in outside data visualization specialists. No data modeling or cleaning work is documented.
- Dashboard and interaction UX: Public exploratory interactives, such as the Haleon Pain Index, which opened a decade of survey data from 80,000+ people to filters by year, country, gender and age. Not operational dashboards.
- Engineering delivery: Ships public websites and interactives, but the tech stack and in-house development capacity are not documented. Physical installations are built with fabricators.
- Domain proof: Global health (The Global Fund, Gates Foundation, Unitaid, Haleon), consulting (BCG), international development (World Bank) and tech and media (Netflix, Autodesk, BBC).
- Engagement fit: A small studio with long-running, retainer-style relationships, suited to communications budgets at large organizations.
Differentiator
The studio was founded by two former BBC.com leaders, Rebecca Conroy and Duncan Swain, and it works like a newsroom: one dataset becomes a report, an animation, a social cut and an interactive. For BCG it produces monthly CEO data animations, a publishing rhythm few studios sustain.
Proof of execution
- The Global Fund (since 2019): Results Report visuals, a two-page summary translated into nine languages, and an interactive site with global, regional and country views.
- Haleon Pain Index: an interactive site that made 80,000+ survey responses publicly explorable for the first time.
- Gates Foundation, Cascade (April 2017): a data video installation on three panels, each 5 m by 30 m, showing about 5.2 billion medicines delivered for neglected tropical diseases, at the NTD Summit in Geneva.
Pricing
Not published.
Potential limitation
Wrong for operational BI, internal product dashboards or data engineering. There is no BI tool work in the portfolio, no public tech stack and no third-party reviews on Clutch.
My take
When data has to persuade donors, journalists or a board, a newsroom-trained team often beats a dashboard specialist. Budget the data preparation separately, though, and decide in advance who owns it. A story built on numbers nobody has checked is the fastest way to lose that audience.
How this list was assessed
Every agency was checked in October 2026 against the same five criteria, using its own case studies, Clutch, Sortlist, GoodFirms and DesignRush profiles, and the published winner lists of the Information is Beautiful, Red Dot, European Design, German Design, Webby and Anthem awards. Each studio had to show signs of activity in 2025 or 2026, such as dated projects, awards or open roles, to make the cut.
No numeric scores appear in this guide, and that is deliberate. Eight of these ten studios have no verified Clutch reviews at all, because public-sector and nonprofit clients rarely leave them. A star average would reward the agencies that chase reviews, not the ones that do the best work.
Where a studio’s public record does not evidence a criterion, the card says so instead of guessing. Absence of a claim is not a failure, but it is information you should have before you sign.
What was left out
- Solo designers and freelancers, however good, because the guide compares teams that can staff a project.
- Tool vendors and BI resellers whose main product is a software licence.
- Studios whose recent activity could not be confirmed, such as Datalands, which ranks well in search but shows no dated work after 2023.
Why Fireart is first
Fireart sits first because this is our blog and because customer-facing dashboards that need both design and production code are exactly what we build. That placement is a statement of fit, not of rank. Interactive Things will beat us on public data portals, Datalabs on Power BI adoption, and CLEVER°FRANKE and Accurat on award-level storytelling.
Which type of data visualization agency fits your situation?
Match the agency to the job you are hiring for, then compare names inside that group. Comparing a BI training partner with an information design studio on the same scorecard is how most shortlists go wrong.
| Your situation | Type of partner | Start with |
|---|---|---|
| You are adding analytics to a SaaS or fintech product | Product design and engineering studio | Fireart Studio, CLEVER°FRANKE, The Visual Agency |
| You run a public agency or health system with Power BI or Tableau already licensed | BI design specialist | Fuselab Creative, Datalabs Agency |
| You publish open or statistical data for citizens and researchers | Public data platform studio | Interactive Things, Graphicacy |
| Your internal dashboards exist, but nobody opens them | BI training and adoption partner | Datalabs Agency, The Visual Agency |
| You need a data story, report or installation for an audience | Information design studio | Accurat, Beyond Words Studio, Graphicacy |
| Your data is scientific or unusually complex and needs a custom tool | Research-grade software studio | Fathom Information Design |
Be honest about which row you are in
Most buyers want two rows at once, usually a polished customer-facing view and an internal BI clean-up. That is fine, but it is two scopes. Brief them separately, even if one agency ends up doing both.
Why do data visualization projects stall?
They stall for three reasons, and the charts are rarely one of them. The dashboard was designed against sample data, nobody agreed on what the metrics mean, or it was built for the person who signed the contract instead of the people who use it every day.
Designed against sample data
A demo with twelve tidy rows always looks good. Production brings null values, late-arriving records, a brand-new account with no history and an enterprise client with 40,000 line items. The CRFB dashboard from Graphicacy is a good illustration: the hard part was not the chart but resampling 61 data streams that update at different cadences.
Nobody owns the metric definitions
If sales, finance and product each mean something different by “active customer”, the dashboard becomes the place where that argument happens in public. An agency cannot settle it for you, but a good one will refuse to design until someone has.
Built for the buyer, not the user
Executives approve screenshots. Analysts, account managers and operators live in the tool. Role-based views, saved filters and alerts matter more to them than the hero chart on the overview page.
Two things to prepare before you brief any agency
- A metric dictionary for the 10 to 15 numbers the dashboard must show: name, formula, source table, owner and refresh cadence.
- A data sample with your ugliest real records: the largest account, the newest account, and a month with missing data.
Both take a week at most, and both will cut the discovery phase of any proposal you receive.
How do you make a dashboard accessible under 2026 rules?
Design to WCAG 2.1 AA from the first wireframe. It is no longer a nice-to-have: it is the reference standard behind the two rules most likely to affect a dashboard buyer in the EU or the US.
| Rule | Who it covers | Key date | Standard |
|---|---|---|---|
| European Accessibility Act | Consumer banking, e-commerce, e-books, transport ticketing and other consumer services in the EU | Applies since 28 June 2025 | EN 301 549, which incorporates WCAG |
| ADA Title II web rule | US state and local governments with 50,000+ residents | April 26, 2027 | WCAG 2.1 AA |
| ADA Title II web rule | Smaller US governments and special districts | April 26, 2028 | WCAG 2.1 AA |
The US dates moved a year later under an interim final rule published on April 20, 2026. The standard itself did not change.
What this means for charts
- Color cannot carry meaning on its own. Add direct labels, patterns or annotations.
- Lines, bars and chart boundaries need at least 3:1 contrast against adjacent colors (WCAG success criterion 1.4.11).
- Tooltips that appear on hover must also appear on keyboard focus and be dismissible (success criterion 1.4.13).
- Every chart needs a keyboard path and a text or table alternative.
The Dutch national Corona dashboard by CLEVER°FRANKE shipped with keyboard-accessible charts, and the Datalabs subsidy estimator was coded to WCAG 2.0. Ask any agency on your shortlist for a similar example. If you already have a dashboard in production, a UX audit is the fastest way to find the gaps.
How much does a data visualization agency cost?
Published entry points on this list start at about AU$4,600 for a private Datalabs workshop and reach $25,000+ minimum projects at Fuselab Creative and €25,000–50,000 typical starting budgets at CLEVER°FRANKE. Where hourly rates are disclosed on Clutch, they run from $50–99 (Fireart) to $100–149 (Fuselab). Large platform builds go much higher: a Clutch reviewer put Fuselab’s POGO spending tracker in the $200,000–999,000 band, and Fireart’s work for Revionics came to around $250,000.
What drives the variance
- Data preparation: the number of sources, how clean they are and how often they refresh. The CRFB dashboard merges 61 data streams on different cadences.
- Build path: a design layer inside an existing BI tool costs far less than custom code with its own backend.
- Roles and states: one executive view is a different project from role-based dashboards with filters, alerts, and empty, loading and permission states.
- Accessibility scope: WCAG 2.1 AA work on charts adds design and testing time, and in 2026 it is rarely optional.
- Location and seniority: a Swiss design sprint of two designers for a week starts at CHF 20,000.
Typical timelines from the cases above
| Scenario | Timeline | Example |
|---|---|---|
| Design sprint and clickable prototype | 5–7 working days | Interactive Things design sprint |
| A set of dashboards inside Tableau or Power BI | About 5 weeks | Datalabs for Marriott APAC, four dashboards |
| Public data platform under time pressure | 1 week to version 1.0, then months of iteration | CLEVER°FRANKE, Dutch Corona dashboard |
| Custom product dashboard MVP with its own backend | About 10 months | Fireart for Sprightful |
Two line items buyers often miss
- Running costs after launch: hosting, data refresh jobs and maintenance. When Graphicacy automated the Union of Concerned Scientists pipeline, the monthly infrastructure bill fell by more than half, which shows how large that line can be.
- Adoption: BI licences, seats and training. A dashboard nobody has been taught to use will not pay back its build cost.
How to compare two quotes
- How many hours are allocated to data cleaning and metric definitions, and who does that work?
- Is the deliverable a design file, a BI workbook or production code?
- How many user roles and screen states are designed?
- What happens after launch: maintenance, data refresh and training?
If you want a scoped estimate for a product dashboard, our web development team can price design and build together.
What should you ask a data visualization agency before signing?
Ask questions that force specific answers. A strong agency will answer most of these in the first call; a weak one will steer back to the portfolio.
About the data
- Show me a dashboard you built that runs on live data today. What broke in its first month?
- Who on your team owns data cleaning and metric definitions?
About delivery
- Who writes the production code, and will the same people maintain it?
- Which charting libraries or BI tools do you plan to use, and why for this project?
About accessibility
- Which WCAG level do you design to, and can you show an example that passed an audit?
About accountability and price
- Which roles and hours are in this quote, and what is explicitly excluded?
- Can we speak to two clients whose project was similar in size to ours?
An agency that struggles with these questions in the first call is showing you something important. If you need extra hands on an existing team instead, design team augmentation is a lighter way to start.
FAQ
What is the best data visualization agency in 2026?
It depends on the job. For customer-facing dashboards inside a product, Fireart Studio designs and builds in one team. For public-sector BI, Fuselab Creative is the safest pick, and for enterprise data platforms with award-level design, CLEVER°FRANKE. Interactive Things leads on public data portals, Datalabs on Power BI and Tableau adoption, and Accurat and Beyond Words on data storytelling.
What does a data visualization agency do?
It turns raw data into charts, dashboards, tools and stories that people can understand and act on. Depending on the studio, the work covers data analysis and cleaning, UX and visual design, front-end and back-end development, BI tool configuration and team training.
Should I hire a data visualization agency or a BI consultant?
Hire a BI consultant when the problem sits in the data warehouse, the licences or the data model. Hire a data visualization agency when people do not understand or use the dashboards, or when the dashboards face customers. Fuselab Creative, Datalabs and The Visual Agency work inside existing BI tools, so they cover part of both.
How long does a dashboard project take?
Based on the cases in this guide, a design sprint takes about a week, a set of BI dashboards about five weeks, and a custom product dashboard MVP with its own backend around ten months. Data preparation is usually what stretches the timeline.
Do data visualization agencies handle accessibility?
The good ones design to WCAG 2.1 AA from the first wireframe, which is now the reference standard for the European Accessibility Act and the US ADA Title II web rule. Ask every shortlisted agency for an example that passed an audit.
Can an agency work alongside my in-house developers?
Yes. Many teams hire a studio for the design system and the hardest screens, then let in-house engineers build the rest. If you need more capacity than that, IT staff augmentation adds designers or developers directly to your team.
Conclusion
The best data visualization agency is the one built for your job. Decide whether you need a product dashboard, a BI clean-up, a public data portal or a data story, then shortlist two or three studios from that group only.
Before the first call, prepare a metric dictionary and a sample of your messiest real data, and bring the due diligence questions above. The answers will tell you more than any award list.
If your dashboard lives inside a product your customers pay for, that is exactly what we design and build at Fireart. Browse our case studies or see how a product design engagement works.





 Kotlin
 C++
 C#
 Ruby on Rails
 Java
 Firebase
 Python
 Vue.js
 HTML5
 CSS3
 Azure